01a Reproducibility
Why published results fail to reproduce, what the words mean, and the habits that prevent it
- Time: about 45 minutes of reading, before or after Lecture 1; the forensic reconstruction (20 minutes) is done in class.
- Slides (PDF): Lecture 1, Reproducibility
- You need: a web browser; Pixi for the Break it step.
- You will have: a one-line verdict on one paper from your field (where it sits on the reproducibility ladder, and what stopped you going higher), which you audit in lesson 01b.
Overview
Why this matters
Your most important collaborator is you, six months from now, and they don’t answer email.
Almost every result in computational biology is the end of a long chain: samples are sequenced, reads are downloaded, trimmed and aligned to a reference, variants or peaks are called with dozens of settings, tables are filtered and joined, and a figure is drawn. The paper describes that chain in a few paragraphs. The details that decide the result (a software version, a default that changed, a sample dropped by hand, the genome build) are rarely among them. When the chain cannot be rerun, nobody can check a surprising result, find where an error came in, or build on the work without starting over. That includes the authors themselves.
This lesson is about why that happens so often, how we know, and what to do about it. It is the argument for everything else in the course.
What you do in this lesson
You read three cases that show different ways a published result can fail, weigh the evidence on how common such failures are, and learn the vocabulary precisely enough to say which kind of failure you are looking at. You then trace the causes, from questionable statistics to unpinned software, and map each cause to a practice (and a lesson of this course) that prevents it. In class you reconstruct the hidden decisions behind a four-sentence methods paragraph; at home you break a tiny analysis on purpose and place a real paper on the reproducibility ladder.
Learning outcomes
After this lesson you can:
- Distinguish reproducibility, replicability, robustness and generalizability, and say which one a given failure is about.
- Interpret the evidence from replication and re-execution studies without overclaiming what the numbers mean.
- Diagnose why results fail to reproduce: questionable research practices, missing pieces, software drift, moving references, hidden state, machine-specific behavior and unseeded randomness.
- Explain the extra threats in machine learning, such as data leakage, and how they differ from plain irreproducibility.
- Map each cause to one of the five pillars of computational reproducibility, and place a published study on the reproducibility ladder.
1. Three ways a result can fail
An academic star who invented his data
Diederik Stapel was one of the most successful social psychologists in Europe. His studies were elegant and his data looked almost perfect. One, published in Science in 2011, reported that people in a messy environment (a Utrecht railway station during a cleaners’ strike) relied more on stereotypes and discriminated more. The station setting, the seating arrangement and the participants never existed: the data were invented. Three junior researchers in his department reported their suspicions in 2011; the investigations that followed found fraud in dozens of his papers, 58 of which have been retracted, and several PhD theses that he supervised were affected.
Stapel is the case people remember, but it is the wrong model for most irreproducible research. Fabrication is rare. What the case does show is how a culture of “publish or perish”, in which a striking result is rewarded and nobody asks for the raw data, lets problems run for years. The same culture produces far more ordinary failures.
Duke: an analysis nobody could check
In 2006, Anil Potti, Joseph Nevins and colleagues at Duke University reported in Nature Medicine that gene-expression signatures derived from cancer cell lines could predict which chemotherapy drug would work for an individual patient. It was exactly what personalized oncology hoped for, and clinical trials began to assign patients to treatment using the signatures.
Keith Baggerly and Kevin Coombes, two biostatisticians at MD Anderson Cancer Center, tried to reproduce the analysis so their own clinicians could use it. The code and the exact data were not available, so they worked backwards from the published results: what Baggerly called forensic bioinformatics. They found gene lists shifted by one row (an off-by-one error, as when a header row is miscounted), the labels “sensitive” and “resistant” reversed for some samples, and samples that appeared more than once (Baggerly and Coombes 2009). Reversed labels matter in a trial: they can steer a patient towards the drug the model should have ranked last.
Their reports did not stop the trials at first: an internal review resumed them in early 2010. The trials stopped for good later that year, after it emerged that Potti had falsely claimed a Rhodes Scholarship. The Nature Medicine paper and many others were retracted, a 2012 Institute of Medicine report recommended that any omics-based test be fully specified, with its data and code, before it is used to guide treatment in a trial, and in 2015 the US Office of Research Integrity found that Potti had committed research misconduct.
Two lessons matter here. First, it took two experts years of reconstruction to find errors that a shared script and a sample sheet would have exposed in an afternoon. Second, reproducibility would not have made the signatures correct: rerunning a mislabeled analysis reproduces the mislabeling. What it would have done is make the errors visible, early, to anyone who looked.
Honest errors, at scale
Most failures involve no misconduct at all:
- A flipped column. In 2006 the structural biologist Geoffrey Chang retracted five papers, three of them in Science, describing the structure of a membrane transport protein. A home-made data-analysis program had swapped two columns of data, inverting the structures (Miller 2006). Other groups had spent years working from, or arguing against, the published models.
- Genes that became dates. Spreadsheet software silently converts gene symbols such as
SEPT2andMARCH1into dates. A scan of supplementary files found these errors in about one in five papers with Excel gene lists (Ziemann et al. 2016); five years later the rate had risen to 30.9% (3,436 of 11,117 papers; Abeysooriya et al. 2021). In 2020 the gene nomenclature committee renamed the affected genes (SEPTIN2,MARCHF1), partly to stop the errors (Bruford et al. 2020). - Rows that disappeared. In October 2020 nearly 16,000 positive COVID-19 tests in England went unreported for about a week, so their contacts were not traced. The results were collected in Excel’s old
.xlsformat, which holds at most 65,536 rows per sheet (the current.xlsxholds 1,048,576); rows past the limit were dropped without a warning.
In each case the error was ordinary, the tool did what it was told, and nobody could see the step that went wrong. That is the problem this course addresses.
2. How big is the problem?
What researchers report
In a Nature survey of 1,576 researchers, more than 70% said they had tried and failed to reproduce another scientist’s experiment, and more than half had failed to reproduce one of their own; 90% agreed there was a “significant” or “slight” reproducibility crisis (Baker 2016). Surveys measure perception, not rates, but the perception is widespread.
What large replication projects found
| Project | What it did | What it found |
|---|---|---|
| Reproducibility Project: Psychology (Open Science Collaboration 2015) | repeated 100 studies from three leading psychology journals, with the original authors’ materials where possible | 97% of the originals had significant results; 36% of the replications did; effects in the replications were on average about half as large |
| Reproducibility Project: Cancer Biology (Errington et al. 2021a, 2021b) | planned to repeat 193 experiments from 53 high-impact papers, with protocols peer reviewed before any work began | could repeat only 50 experiments from 23 papers; for positive effects the median effect size was 85% smaller, and 40% (39 of 97) replicated on at least three of five criteria |
| Brazilian Reproducibility Initiative (reprodutibilidade.bio.br; design in Amaral et al. 2019) | 56 laboratories across Brazil repeated experiments that use common biomedical methods: 143 replications of 56 experiments, 2019 to 2025 | success rates between about 15% and 45%, depending on how success was defined |
The cancer biology project is especially telling for this course, because its biggest obstacle was not the biology. The data needed to compute effect sizes were publicly available for 4 of the 193 experiments; the authors could not provide them for 68%; and none of the 193 experiments was described in enough detail to design a replication from the paper alone (Errington et al. 2021b). Before anyone could test whether the results held, they had to find out what had been done.
What happens when someone reruns the code
Computational work should be the easy case: no reagents, no animals, just files and programs. The evidence says otherwise.
| Study | What was checked | Result |
|---|---|---|
| Ioannidis et al. 2009 | 18 microarray papers in Nature Genetics; one table or figure each, by two independent teams | 2 reproduced in principle, 6 partially, 10 not at all; the main cause was that the data were not available |
| Stodden et al. 2018 | 204 papers in Science after the journal began requiring data and code on request | artifacts obtained for 44%; findings reproduced for 26% |
| Pimentel et al. 2019 | about 860,000 attempts to run Jupyter notebooks on GitHub | 24% ran without error; 4% gave the same results |
| Trisovic et al. 2022 | over 9,000 R files in replication packages on Harvard Dataverse | 74% failed on the first run; 56% still failed after automatic clean-up |
| Samuel and Mietchen 2024 | 22,578 Python notebooks linked to biomedical papers | 1,203 ran without errors; 879 gave the published results |
The reasons were mostly mundane: a package that was not listed, a file path that only existed on the author’s computer, a cell run out of order, an input file that was never shared.
Reading these numbers carefully
These studies are not measurements of one quantity, and a careful reader avoids three common mistakes:
- “36% of psychology is true.” No. A replication can fail because the original was a false positive, because the replication was underpowered, or because populations and procedures differed. A single replication with p = 0.08 does not show that the original was false; compare effect sizes and their uncertainty instead.
- “Smaller effects mean fraud.” Shrinking effects are what you expect when small studies are published only if they cross a significance threshold (the “winner’s curse”; see section 5).
- Comparing percentages across studies. Each study sampled different papers (often high-profile ones), defined success differently and had different resources.
What the evidence does show, consistently, is that a large share of published work cannot be checked at all, because the data, code or details needed to check it are missing. That part is entirely within our control.
3. What the words mean
Fields have used “reproducible” and “replicable” in different, sometimes opposite, ways. The US National Academies of Sciences, Engineering, and Medicine (NASEM 2019) settled on definitions that this course uses:
- Reproducibility: obtaining consistent results using the same input data, computational steps, methods, code and conditions of analysis.
- Replicability: obtaining consistent results across studies aimed at answering the same scientific question, each of which has obtained its own data.
Reproducibility is mostly a computational question, and it should be close to guaranteed. Replicability is a scientific question: some failures are expected, and they are informative. A rigorous, honest, well-analyzed study should always be reproducible, yet it may still fail to replicate, because nature is noisy and contexts differ.
The Turing Way extends this to a 2 × 2 grid (figure), which asks what changes:
| Same data | Different data | |
|---|---|---|
| Same analysis | Reproducible: rerun my code on my data | Replicable: same method, new cohort |
| Different analysis | Robust: other reasonable pipelines agree | Generalizable: holds beyond the original setting |
A finding you can trust survives all four. In genomics, robust often means “does the variant call survive a different aligner or a stricter filter?”, and generalizable often means “does the model work in another hospital, on another sequencing platform, or in people of other ancestries?”.
Goodman, Fanelli and Ioannidis (2016) proposed a different split: methods reproducibility (is there enough detail to repeat exactly what was done?), results reproducibility (does an independent repeat give the same results?) and inferential reproducibility (would others draw the same conclusions from the evidence?). The Association for Computing Machinery’s artifact badges used “reproducible” and “replicable” the other way round until 2020, when they were swapped to match NASEM. When you write about reproducibility, say which meaning you use.
Reproducibility is the minimum. If a result cannot be reproduced from its own data and code, a failed replication is impossible to interpret: was the biology different, or was the analysis? This is why the rest of the course concentrates on reproducibility first.
A spectrum, not a yes or no
Roger Peng (2011) described reproducibility as a spectrum, from a paper alone (not reproducible) to full replication (the gold standard), with each step adding code, data, or links that let a reader execute them. The lectures turn this into a ladder you can climb one rung at a time:
| Rung | What a reader gets | What they can check |
|---|---|---|
| 0 | the paper and its figures | nothing beyond the text |
| 1 | + code | the logic, by reading |
| 2 | + data, or accessions to it | the numbers, if they can rebuild the software |
| 3 | + a pinned environment (lock file, container) | the numbers, on their own computer |
| 4 | + one command that reruns everything from raw data | the whole analysis, in an afternoon |
| 5 | + tests, automated reruns, an archived release with a DOI | that it still works, years later |
By the end of this course your LTEE project reaches rung 5.
- You rerun a published Snakemake workflow on the authors’ FASTQ files and get the same variant calls. Reproducible.
- A second cohort, sequenced in another country, shows the same association. Replicable (and evidence of generalizability, if the populations differ).
- Switching from BWA to Bowtie2 and from one variant caller to another leaves the conclusion unchanged. Robust.
- A model trained on one hospital’s images works in three others with different scanners. Generalizable.
- You rerun the code and get a different number because a package changed. The result is not reproducible as published, though it may become so once you pin the original version.
4. Why bother? Five selfish reasons
Reproducibility is usually sold as a duty to science. Florian Markowetz (2015) argued that it is first in your own interest:
- It helps you avoid disaster. Errors found before publication are cheap; errors found after it are retractions. Chang’s flipped column cost five papers.
- It makes it easier to write papers. When every number in the manuscript comes from a script, “where did this figure come from?” has an answer, and the methods section half writes itself.
- It helps reviewers see it your way. A reviewer who can rerun your analysis argues with your science, not with your description of it.
- It enables continuity of your work. Students and postdocs leave; a project that only runs on one person’s laptop leaves with them.
- It helps to build your reputation. Work that others can reuse gets used, cited and trusted.
The fourth reason is the one that applies to every graduate student: the person most likely to rerun your analysis is you, six months from now, when a reviewer asks for one more figure. When should you worry about reproducibility? Before you start a project, while you write the code, when you write the paper, when you co-author one, when you review one: in short, all the time. It is cheapest on day one and most expensive the week before submission.
5. Where research goes wrong
The research cycle and its weak points
Research runs in a cycle: generate a hypothesis, design a study, collect data, analyze it, interpret it, publish, and start the next experiment. Each step has a characteristic way of going wrong (Munafò et al. 2017, after Chris Chambers). Most of these practices are not fraud: they are choices that feel reasonable at the time and inflate the false-positive rate.
| Practice | What it looks like | What counters it |
|---|---|---|
| p-hacking | trying analyses (covariates, exclusions, transformations) until something crosses p < 0.05 | an analysis plan fixed in advance; report everything you tried |
| Forking paths | many defensible choices, only one reported, even without deliberate searching (Gelman and Loken 2014) | multiverse or sensitivity analysis: show the result across reasonable choices |
| HARKing | Hypothesizing After the Results are Known: presenting a post hoc finding as if it were the original hypothesis (Kerr 1998) | preregistration; label exploratory work as exploratory |
| Low power | small samples, so true effects are often missed and significant ones are often false or exaggerated | power analysis; larger samples; collaboration across labs |
| Publication bias | null results stay in the drawer, so the literature over-represents positive ones | Registered Reports; preprints; publishing null results |
Simmons, Nelson and Simonsohn (2011) showed how quickly these add up: with a handful of common, undisclosed flexibilities (when to stop collecting data, which outcome to report, whether to add a covariate), the chance of finding a “significant” effect that does not exist rose from the nominal 5% to above 60% in their simulations.
Low power deserves a second look, because it explains the shrinking effects in the replication projects. Button et al. (2013) estimated that the median statistical power in neuroscience studies was about 21%. In a field like that, the studies that happen to reach significance are mostly the ones that overestimated the effect, so when they are repeated, the effect shrinks. This is the winner’s curse, and it needs no misconduct at all.
Why the same data and code give different answers
Computational analyses have their own failure points, even when the statistics are sound:
| Cause | What it looks like | A real case |
|---|---|---|
| Missing pieces | code never shared; raw data not deposited; a step done by hand in a spreadsheet | most failures in Ioannidis et al. (2009) were data that were not available |
| Software drift | unpinned package versions; a default that changed between releases | FreeSurfer 5.0.0 gave brain volumes that differed by 8.8% on average (up to 64%) from earlier versions, and results also depended on the workstation and macOS version (Gronenschild et al. 2012); scikit-learn’s random forests went from 10 to 100 trees by default in version 0.22 |
| Moving references | genome build (hg19 or hg38), annotation release or database snapshot not recorded | the same coordinates name different bases in different builds; gene models change between Ensembl releases |
| Hidden state | notebook cells run out of order; variables left in memory from an earlier run | the main failure mode in the notebook studies above |
| Machine-specific behavior | hard-coded paths; operating-system-dependent file ordering; multi-threaded or GPU arithmetic | widely used chemistry scripts gave different NMR predictions on different operating systems, because they assumed files were listed in sorted order (Bhandari Neupane et al. 2019) |
| Unseeded randomness | subsampling, clustering, train/test splits, UMAP or t-SNE layouts without a fixed seed | a “cluster” that appears with one seed and vanishes with another |
The Break it step below reproduces one of these failures on your own computer in under a minute.
Set and report seeds for everything random, but do not stop there: one lucky seed is not a result, so check that conclusions hold across several. Expect small numerical drift where floating-point sums are reordered (threads, GPUs), and define “the same” in advance: identical files, identical within a tolerance, or the same conclusion?
Who is responsible?
When a result cannot be reproduced, it is tempting to blame the individual. Responsibility is shared. Researchers document their methods, data and code, and train their students to do the same. Institutions set policies and reward reproducible work in hiring and promotion. Funders require open code and data, and fund the time it takes. Journals check that code and data are available, and publish replications and null results. Societies and the public ask for transparency. But the one link in that chain you control today is the first: responsibility begins with the researcher.
Think (2 minutes): write down one or two factors that hurt reproducibility in your own field. Pair (3 minutes): with a neighbor, discuss how each could be fixed, and by whom. Share (3 minutes): report back; the class sorts the answers into technical, human, statistical and incentive problems.
6. Machine learning and AI
Machine learning has a reproducibility crisis of its own. Code, data and trained models are often not shared; hyperparameters and preprocessing go undocumented; results depend on the GPU type and the random seed; and the pressure to beat a benchmark rewards cherry-picking (Ball 2023).
The most damaging problem is data leakage: information from the test set reaches the model during training, so its reported performance is inflated. Kapoor and Narayanan (2023) found leakage in published work in 17 fields, affecting 294 papers, sometimes with wildly over-optimistic conclusions; they describe eight kinds, from textbook errors to subtle ones. Two are common in genomics and medicine:
- Preprocessing or feature selection on all the data before splitting. If you choose the 50 most differentially expressed genes using every sample, and only then split into training and test sets, the test set helped choose the features. Every step that learns from data belongs inside the training fold.
- Non-independent samples. Several samples from the same patient, or near-identical sequences, on both sides of the split. The model recognizes the patient, not the disease.
Leakage is not irreproducibility: a leaky analysis can rerun perfectly and give the same inflated number every time. It is a threat to validity, which reproducibility makes visible but does not fix.
Generative AI adds new risks. Large language models can produce plausible but wrong code, text and citations; the speed of AI-assisted publishing outpaces peer review; and in 2025 researchers found manuscripts with hidden instructions, in white or tiny text, telling AI reviewers to give only positive reviews (Lin 2025). Proprietary models and the compute needed to train large ones put independent verification out of reach for most groups.
AI is also a tool for reproducibility: it can draft tests, documentation, Dockerfiles and workflow rules, log experiments automatically (with tools such as MLflow or Weights & Biases) and spot anomalies in data. Use it, then check what it writes, and say in your methods that you used it.
7. The toolkit: five pillars
Every analysis, whatever the field, has the same parts: data and code go into a workflow that runs in a software environment and produces results.
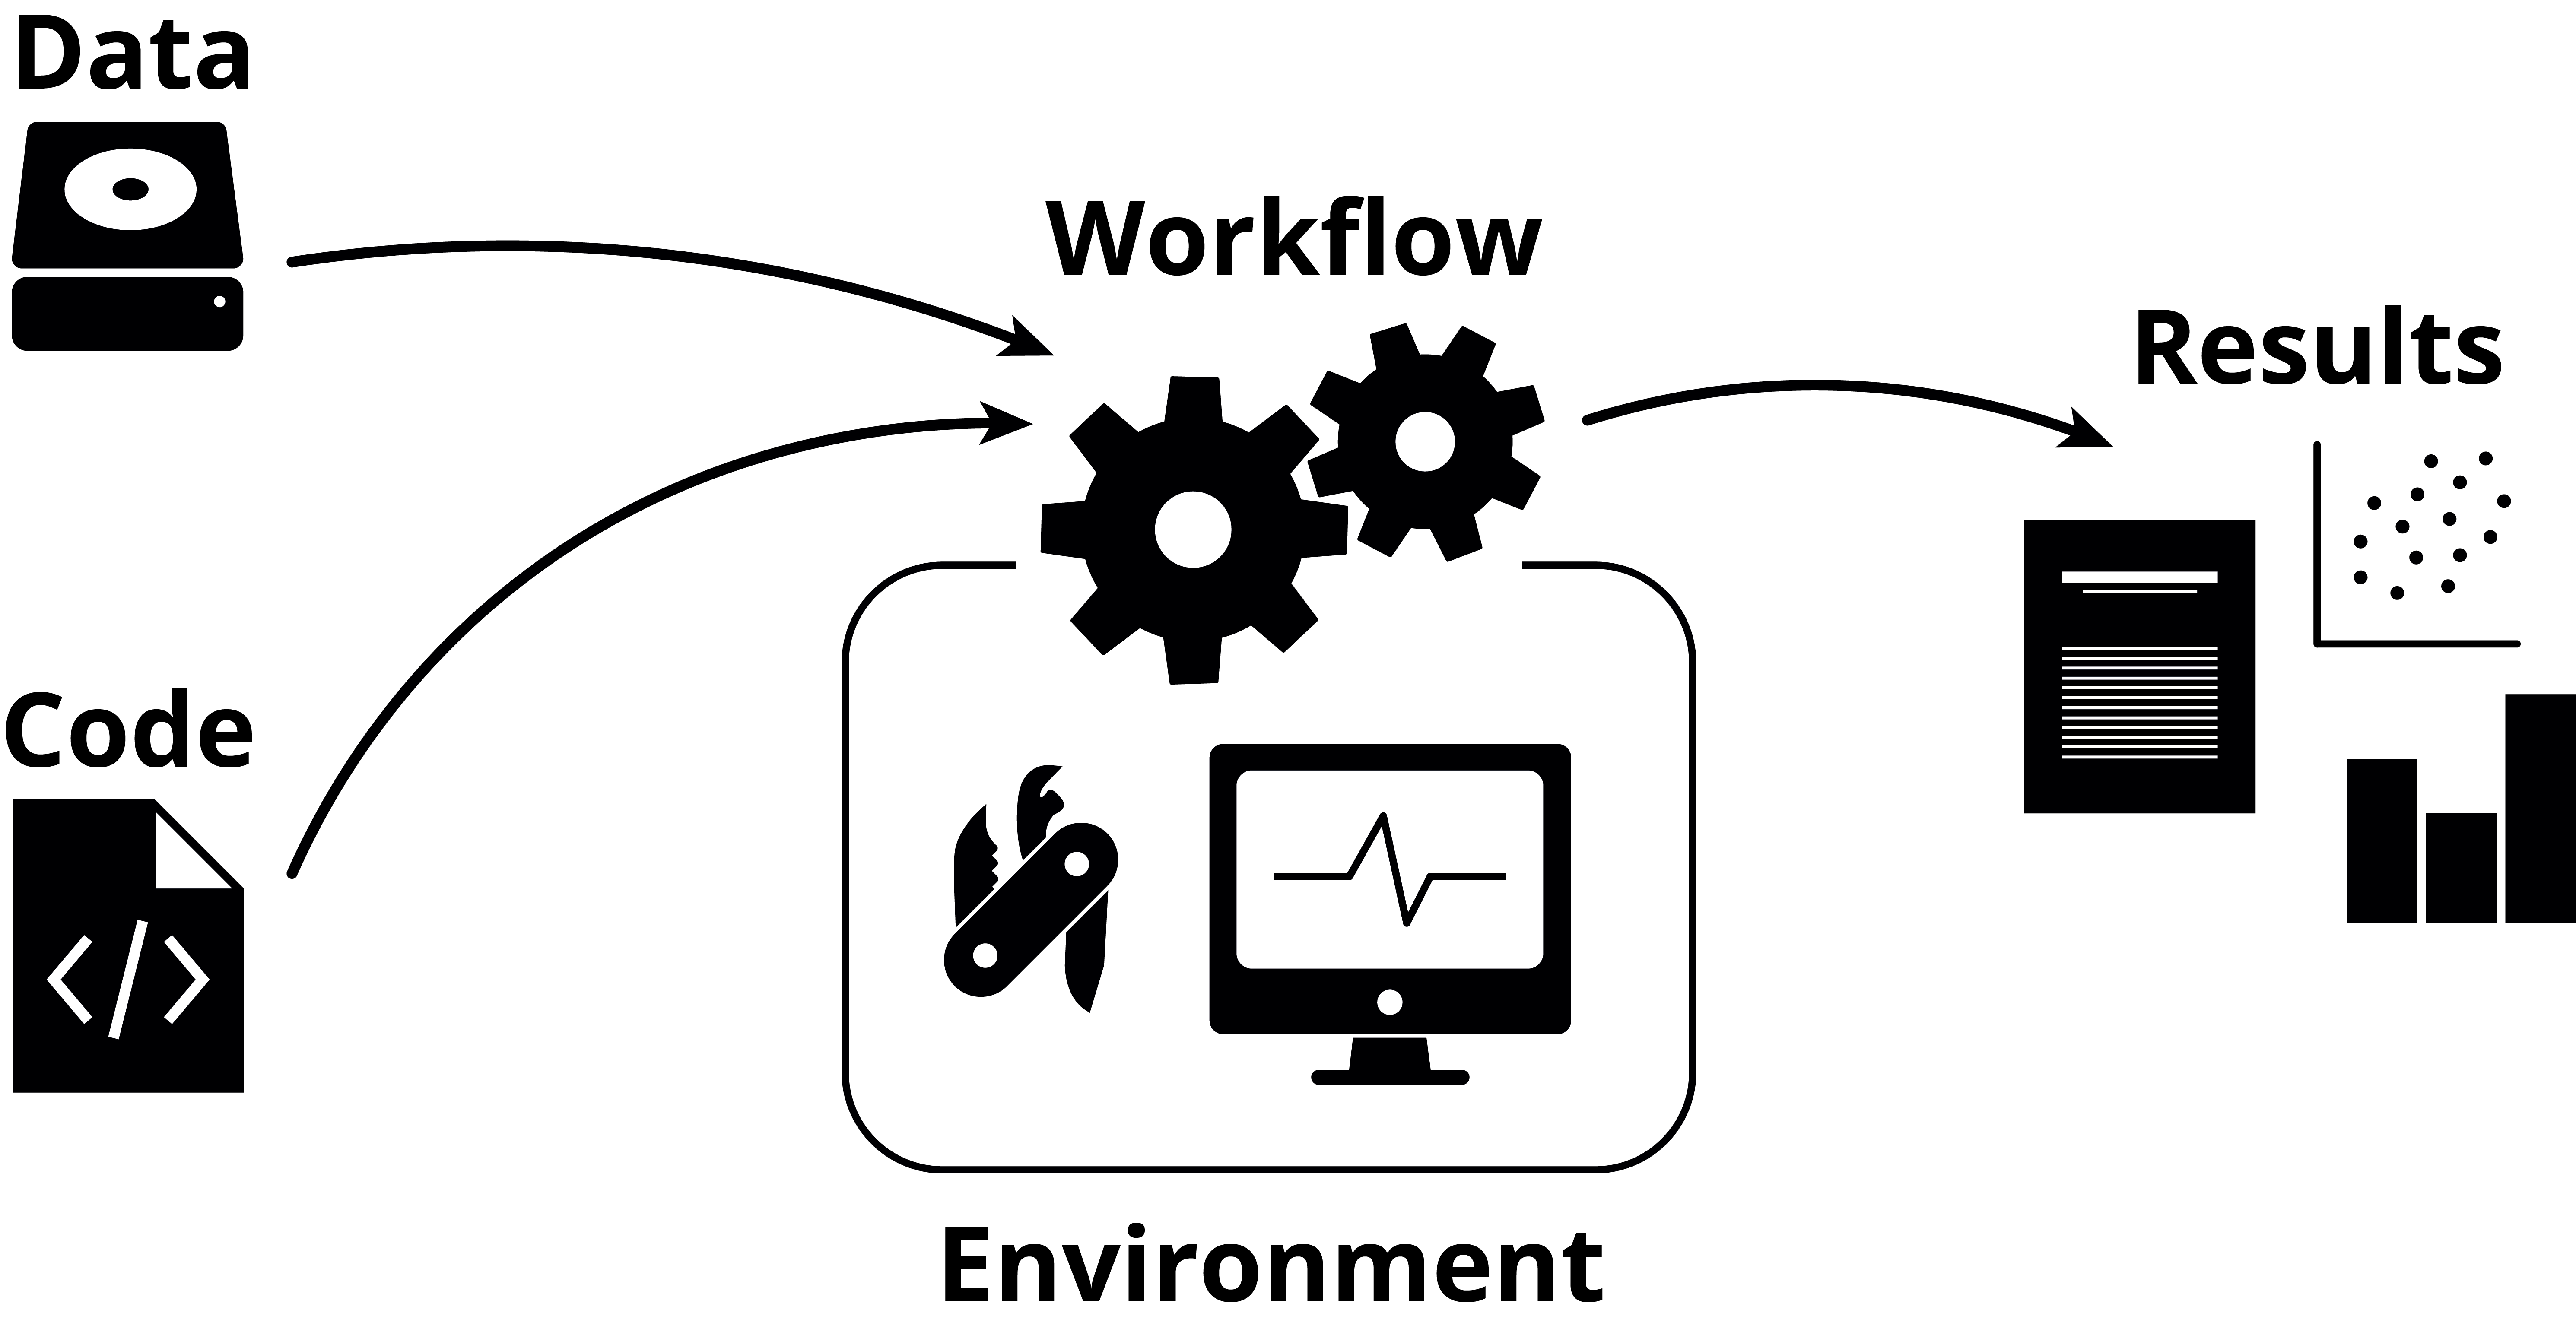
Ziemann, Poulain and Bora (2023) organized the practices that keep those parts reproducible into five pillars of computational reproducibility. Each answers some of the causes in section 5:
| Pillar | What it prevents | In this course |
|---|---|---|
| Literate programming: code, results and explanation in one document | undocumented steps; numbers copied by hand into a manuscript | 06 Jupyter, 07 Quarto |
| Code version control and sharing | “which version of the script made Figure 3?”; code that never leaves the laptop | 04 Git and GitHub |
| Compute environment control | software drift; “works on my machine” | 05 Pixi, 08 Containers |
| Persistent data sharing | missing pieces; moving references | 03 Data management, 12 Putting it together |
| Documentation | nobody knows what to run, in which order, or why | 11 Documentation, and every lesson |
Two practices tie the pillars together. Workflow managers (09 Snakemake, 10 Nextflow) turn a pipeline into one command that knows what depends on what: a methods section that cannot be out of date. Checksums and automated reruns (tests and continuous integration) prove that the inputs are the ones you think and that the whole thing still runs.
- For every result, keep track of how it was produced.
- Avoid manual data manipulation steps.
- Archive the exact versions of all external programs used.
- Version-control all custom scripts.
- Record all intermediate results, when possible in standard formats.
- For analyses that include randomness, note the underlying random seeds.
- Always store the raw data behind plots.
- Generate hierarchical analysis output, allowing layers of increasing detail to be inspected.
- Connect textual statements to underlying results.
- Provide public access to scripts, runs and results.
More than a decade on, every rule still applies, and each maps onto one of the pillars.
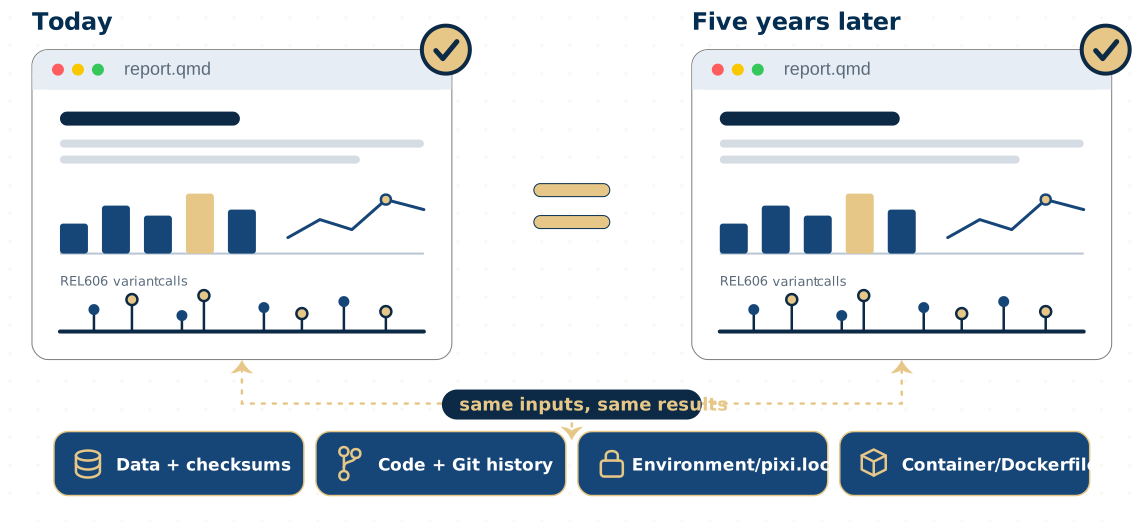
When you hand an analysis to someone else, give them: (1) identifiable inputs and reference files, with checksums; (2) the code at a specific commit or release; (3) the environment, as a lock file or a container recipe; (4) one entry point: a command or a workflow; (5) the expected outputs, and a way to check them; (6) a README that states the limitations and any access restrictions.
8. In class: forensic reconstruction (20 minutes)
Here is a typical methods paragraph (invented for this exercise, but you have read many like it):
Reads were trimmed and aligned to the human genome using Bowtie2 with default parameters. Duplicates were removed and peaks were called with MACS2 (p < 0.01). Differential binding between conditions was assessed with DESeq2, and regions with FDR < 0.05 were considered significant. Motif enrichment was performed using HOMER.
- Alone (8 minutes). List every decision you would need to rerun this analysis. Circle each one the paragraph leaves unstated.
- In pairs (8 minutes). Draw the analysis as boxes and arrows. On each arrow, write what is missing to make that step rerunnable.
- In pairs (4 minutes). Place the paper on the ladder (0 to 5) and write the one fix that would help a reader most.
- Data: accessions; replicates per condition; input or control samples; read length; paired or single end.
- References: genome build; which contigs were kept; blacklisted regions; annotation release; HOMER’s genome and motif library versions.
- Parameters: trimming tool and adapters; mapping-quality filter; duplicate-removal tool; MACS2 mode and genome size; how peaks from replicates were merged into a consensus set; how reads were counted in peaks; the DESeq2 design formula; HOMER’s background and region size.
- Software: a version for each of the four named tools, and for the unnamed ones (trimmer, duplicate removal, counting); and what “default” meant in that version.
A shared workflow file and a lock file would have answered every one of these questions without a single extra sentence of prose. Prose cannot carry a pipeline; code, environments and workflows can.
A paper reports 92% accuracy for a model that classifies 150 tumor samples. Its GitHub repository contains one notebook and no environment file. The notebook reads data/final.csv, which is not in the repository. The paper says “fivefold cross-validation”, but the notebook selects the top genes on all 150 samples before the cross-validation loop.
Name one problem of access, one of computational reproducibility and one of validity. Which of them could inflate the reported accuracy even if the notebook ran perfectly? What is the smallest set of changes after which you would believe the number?
Answer. Access: final.csv is missing, and nothing says how it was made from raw data. Reproducibility: no environment file, so package versions are unknown, and a notebook may depend on the order its cells were run. Validity: feature selection before cross-validation is leakage, and it inflates the accuracy even when everything else is perfect. Fix: deposit the raw data (or an accession) and the script that makes final.csv; pin the environment; move feature selection inside each training fold; and test the final model on an independent cohort.
Break it: same code, same data, a different file
Software that gives a different file on every run, with nothing changed, is not a curiosity: it is what makes “is my result the same as yours?” hard to answer. Here is a three-line analysis that writes the genes that passed a filter. Make a folder for this lesson and save it:
mkdir -p ~/cbio7501/break-it-01a
cd ~/cbio7501/break-it-01a
hits.py
# Write the genes that passed the filter, one per line.
hits = {"TP53", "BRCA1", "EGFR", "KRAS", "MYC", "PTEN", "SEPTIN2", "MARCHF1"}
with open("hits.txt", "w") as f:
    for gene in hits:
        print(gene, file=f)
Run it five times, and print the file on one line each time:
for run in 1 2 3 4 5; do
  pixi exec python hits.py
  paste -s -d " " hits.txt
done
BRCA1 MARCHF1 EGFR PTEN KRAS SEPTIN2 TP53 MYC
SEPTIN2 MYC PTEN MARCHF1 EGFR KRAS TP53 BRCA1
MARCHF1 BRCA1 PTEN MYC SEPTIN2 EGFR KRAS TP53
BRCA1 TP53 PTEN SEPTIN2 KRAS EGFR MARCHF1 MYC
TP53 KRAS MYC SEPTIN2 EGFR MARCHF1 PTEN BRCA1Your orders will differ from these, and from each other. The data and the code did not change; the order of the genes did. A Python set has no order, and Python randomizes how it stores text each time it starts (a security feature), so the genes come out differently on each run. Five runs, five different files: their checksums (lesson 03) all differ, and a later step that takes “the first three genes” gets a different answer every time.
Fix it by making the order explicit, and run it again:
sed -i.bak 's/for gene in hits:/for gene in sorted(hits):/' hits.py
for run in 1 2 3; do
  pixi exec python hits.py
  paste -s -d " " hits.txt
done
BRCA1 EGFR KRAS MARCHF1 MYC PTEN SEPTIN2 TP53
BRCA1 EGFR KRAS MARCHF1 MYC PTEN SEPTIN2 TP53
BRCA1 EGFR KRAS MARCHF1 MYC PTEN SEPTIN2 TP53Two lessons. Anything a program does not promise (the order of a set, of the files in a folder, of the results of a parallel loop) can change between runs, computers and versions. And decide in advance what “the same result” means: here the same set of genes came out every time, but not the same file.
Homework: place a paper on the ladder
Pick one recent paper in your area: one you cite, or one close to the analysis you plan for your capstone. Try to find its raw data, its code and its software versions. Spend no more than 30 minutes. Bring a one-line verdict: where does it sit on the ladder, and what stopped you going one rung higher? In lesson 01b you audit the same paper in detail.
Apply it to your own project
Take the analysis you know best (your thesis, your last paper, or the one you plan for the capstone) and write down, honestly, which rung of the ladder it is on today. Then list the decisions in it that live only in your head: the genome build, a sample you dropped, the version of the aligner, the threshold you tried three times. Those are the things the rest of this course will move out of your head and into files.
Key points
- Reproducibility (same data, same analysis) should be close to certain; replicability (new data) is the scientific test. Robustness and generalizability go further.
- Across fields, many published results cannot be checked at all, because data, code or details are missing; effects often shrink when studies are repeated.
- Most failures are honest and mundane: missing files, unpinned versions, moving references, hidden state, paths and seeds.
- A reproducible analysis can still be wrong (leakage, mislabeling), but it lets anyone see why.
- Prose cannot carry a pipeline; code, environments and workflows can. Climb the ladder one rung at a time, starting with your next analysis.
Further reading
The core readings for this lesson:
- National Academies of Sciences, Engineering, and Medicine (2019). Reproducibility and Replicability in Science. https://doi.org/10.17226/25303
- Sandve GK, Nekrutenko A, Taylor J, Hovig E (2013). Ten simple rules for reproducible computational research. PLoS Comput Biol 9:e1003285. https://doi.org/10.1371/journal.pcbi.1003285
- Wilson G, Bryan J, Cranston K, et al. (2017). Good enough practices in scientific computing. PLoS Comput Biol 13:e1005510. https://doi.org/10.1371/journal.pcbi.1005510
- Markowetz F (2015). Five selfish reasons to work reproducibly. Genome Biol 16:274. https://doi.org/10.1186/s13059-015-0850-7
- Ziemann M, Poulain P, Bora A (2023). The five pillars of computational reproducibility: bioinformatics and beyond. Brief Bioinform 24:bbad375. https://doi.org/10.1093/bib/bbad375
- Baggerly KA, Coombes KR (2009). Deriving chemosensitivity from cell lines: forensic bioinformatics and reproducible research in high-throughput biology. Ann Appl Stat 3:1309–1334. https://doi.org/10.1214/09-AOAS291
Going further: Noble (2009) on organizing a computational biology project, which is where lesson 02 starts; Kapoor and Narayanan (2023) on leakage; and The Turing Way’s guide for reproducible research.
References
- Abeysooriya M, Soria M, Kasu MS, Ziemann M (2021). Gene name errors: lessons not learned. PLoS Comput Biol 17:e1008984. https://doi.org/10.1371/journal.pcbi.1008984
- Amaral OB, Neves K, Wasilewska-Sampaio AP, Carneiro CF (2019). The Brazilian Reproducibility Initiative. eLife 8:e41602. https://doi.org/10.7554/eLife.41602
- Baker M (2016). 1,500 scientists lift the lid on reproducibility. Nature 533:452–454. https://doi.org/10.1038/533452a
- Ball P (2023). Is AI leading to a reproducibility crisis in science? Nature 624:22–25. https://doi.org/10.1038/d41586-023-03817-6
- Bhandari Neupane J, Neupane RP, Luo Y, et al. (2019). Characterization of leptazolines A–D, polar oxazolines from the cyanobacterium Leptolyngbya sp., reveals a glitch with the “Willoughby–Hoye” scripts for calculating NMR chemical shifts. Org Lett 21:8449–8453. https://doi.org/10.1021/acs.orglett.9b03216
- Bruford EA, Braschi B, Denny P, et al. (2020). Guidelines for human gene nomenclature. Nat Genet 52:754–758. https://doi.org/10.1038/s41588-020-0669-3
- Button KS, Ioannidis JPA, Mokrysz C, et al. (2013). Power failure: why small sample size undermines the reliability of neuroscience. Nat Rev Neurosci 14:365–376. https://doi.org/10.1038/nrn3475
- Errington TM, Mathur M, Soderberg CK, et al. (2021a). Investigating the replicability of preclinical cancer biology. eLife 10:e71601. https://doi.org/10.7554/eLife.71601
- Errington TM, Denis A, Perfito N, Iorns E, Nosek BA (2021b). Challenges for assessing replicability in preclinical cancer biology. eLife 10:e67995. https://doi.org/10.7554/eLife.67995
- Gelman A, Loken E (2014). The statistical crisis in science. American Scientist 102:460–465. https://doi.org/10.1511/2014.111.460
- Goodman SN, Fanelli D, Ioannidis JPA (2016). What does research reproducibility mean? Sci Transl Med 8:341ps12. https://doi.org/10.1126/scitranslmed.aaf5027
- Gronenschild EHBM, Habets P, Jacobs HIL, et al. (2012). The effects of FreeSurfer version, workstation type, and Macintosh operating system version on anatomical volume and cortical thickness measurements. PLoS ONE 7:e38234. https://doi.org/10.1371/journal.pone.0038234
- Ioannidis JPA, Allison DB, Ball CA, et al. (2009). Repeatability of published microarray gene expression analyses. Nat Genet 41:149–155. https://doi.org/10.1038/ng.295
- Kapoor S, Narayanan A (2023). Leakage and the reproducibility crisis in machine-learning-based science. Patterns 4:100804. https://doi.org/10.1016/j.patter.2023.100804
- Kerr NL (1998). HARKing: hypothesizing after the results are known. Pers Soc Psychol Rev 2:196–217. https://doi.org/10.1207/s15327957pspr0203_4
- Lin Z (2025). Hidden prompts in manuscripts exploit AI-assisted peer review. arXiv:2507.06185. https://arxiv.org/abs/2507.06185
- Miller G (2006). A scientist’s nightmare: software problem leads to five retractions. Science 314:1856–1857. https://doi.org/10.1126/science.314.5807.1856
- Munafò MR, Nosek BA, Bishop DVM, et al. (2017). A manifesto for reproducible science. Nat Hum Behav 1:0021. https://doi.org/10.1038/s41562-016-0021
- Noble WS (2009). A quick guide to organizing computational biology projects. PLoS Comput Biol 5:e1000424. https://doi.org/10.1371/journal.pcbi.1000424
- Open Science Collaboration (2015). Estimating the reproducibility of psychological science. Science 349:aac4716. https://doi.org/10.1126/science.aac4716
- Peng RD (2011). Reproducible research in computational science. Science 334:1226–1227. https://doi.org/10.1126/science.1213847
- Pimentel JF, Murta L, Braganholo V, Freire J (2019). A large-scale study about quality and reproducibility of Jupyter notebooks. Proceedings of the 16th International Conference on Mining Software Repositories, 507–517. https://doi.org/10.1109/MSR.2019.00077
- Samuel S, Mietchen D (2024). Computational reproducibility of Jupyter notebooks from biomedical publications. GigaScience 13:giad113. https://doi.org/10.1093/gigascience/giad113
- Simmons JP, Nelson LD, Simonsohn U (2011). False-positive psychology: undisclosed flexibility in data collection and analysis allows presenting anything as significant. Psychol Sci 22:1359–1366. https://doi.org/10.1177/0956797611417632
- Stodden V, Seiler J, Ma Z (2018). An empirical analysis of journal policy effectiveness for computational reproducibility. PNAS 115:2584–2589. https://doi.org/10.1073/pnas.1708290115
- Trisovic A, Lau MK, Pasquier T, Crosas M (2022). A large-scale study on research code quality and execution. Sci Data 9:60. https://doi.org/10.1038/s41597-022-01143-6
- Ziemann M, Eren Y, El-Osta A (2016). Gene name errors are widespread in the scientific literature. Genome Biol 17:177. https://doi.org/10.1186/s13059-016-1044-7